See how your agent is doing
Insights is one dashboard for every call and chat your agents handle — how much traffic came in, how it went, and which agents carry the load. This page shows you how to read it.
Open Insights under the Analytics group in the dashboard sidebar (the page itself is titled Analytics). It rolls up every session — voice calls and chats, from the playground, widgets, campaigns, the API, and your phone numbers — into KPI cards, charts, breakdowns, and leaderboards.
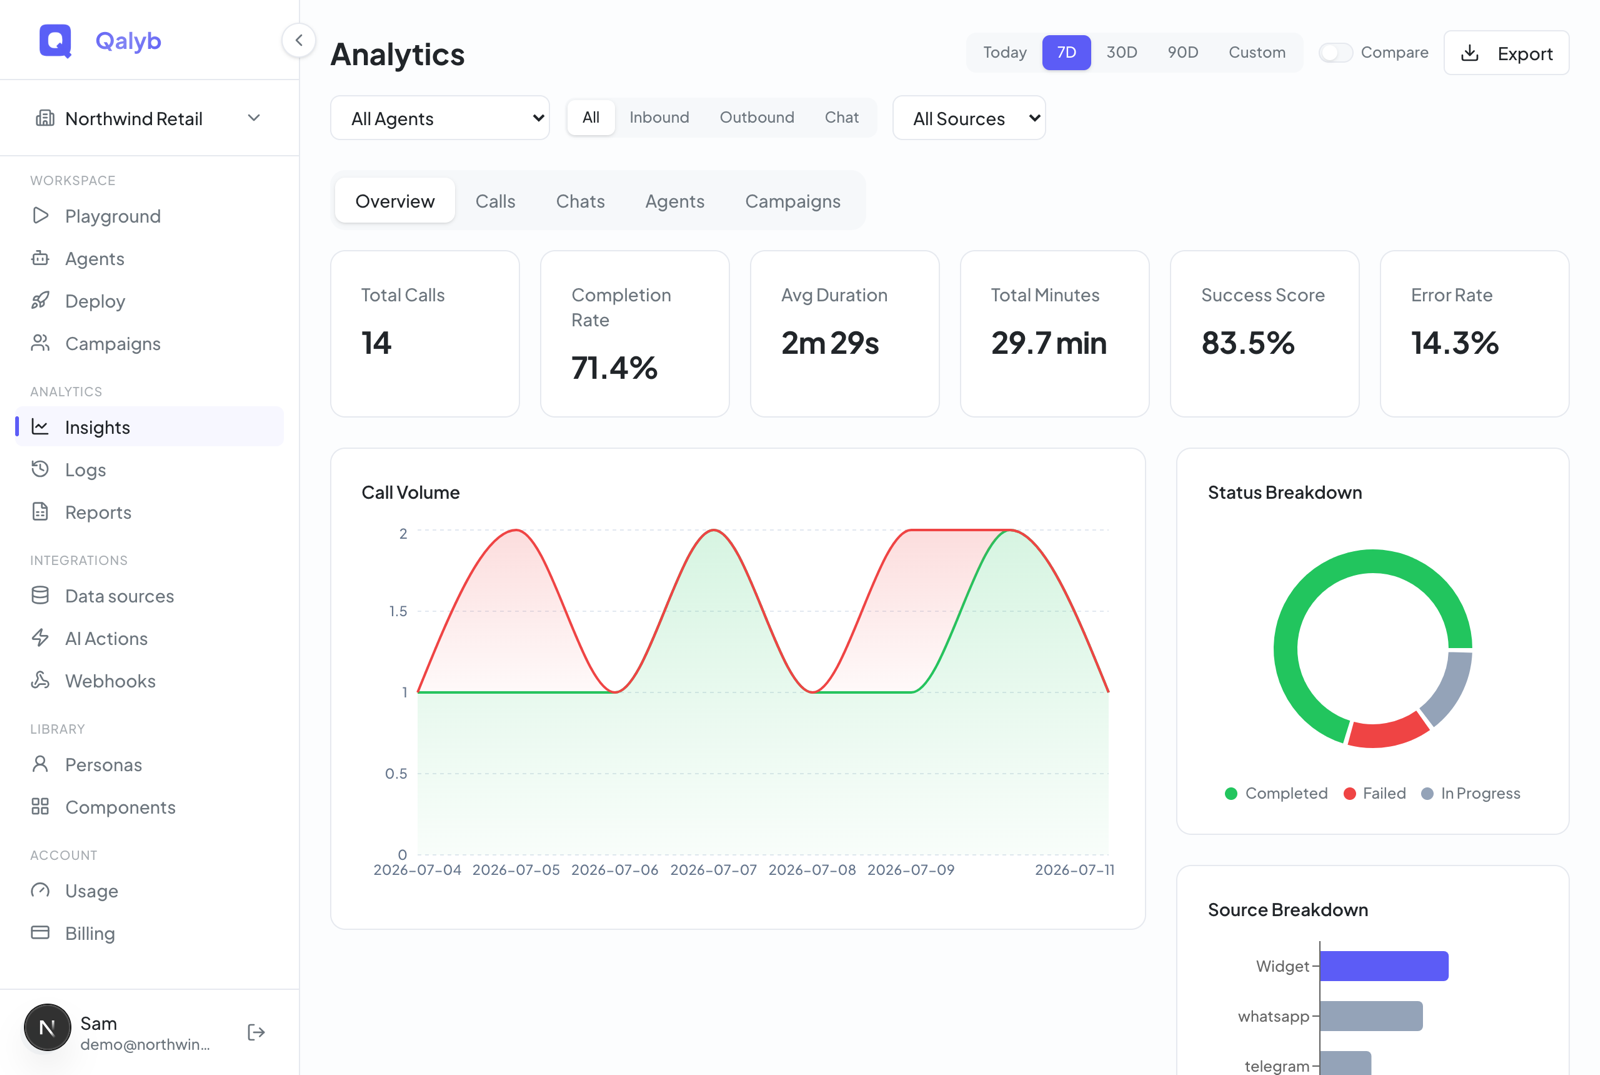
Pick your window and filters
Every tab shares one header. It controls the time window and the slice of traffic you are looking at, and all of its state lives in the URL — so any view you build is a link you can bookmark or share with your team.
- Time range — Today, 7d (the default), 30d, 90d, or Custom with explicit from and to dates. Your timezone is detected automatically from the browser, so day boundaries match your local clock.
- Compare — toggle it on to see period-over-period change. Each KPI card then shows the percentage change versus the immediately preceding window of the same length — last 7 days versus the 7 before that, and so on.
- Filters — narrow every chart and KPI at once by Agent (one agent or all), Direction (all, inbound, outbound, or chat), and Source (playground, widget, campaign, API, or telephony).
What each tab shows
Overview
Overview is the default landing tab and the one most teams keep open. It answers the first-glance questions: how much traffic, how much of it succeeded, and which agents are carrying it.
- KPI cards — Total Calls, Completion Rate, Avg Duration, Total Minutes, Success Score, and Error Rate. With Compare on, each card carries a period-over-period percentage change.
- Call Volume — sessions over time across the selected range.
- Breakdowns — Status, Source, and Sentiment distributions.
- Agent Leaderboard — your top 5 agents by volume.
Calls
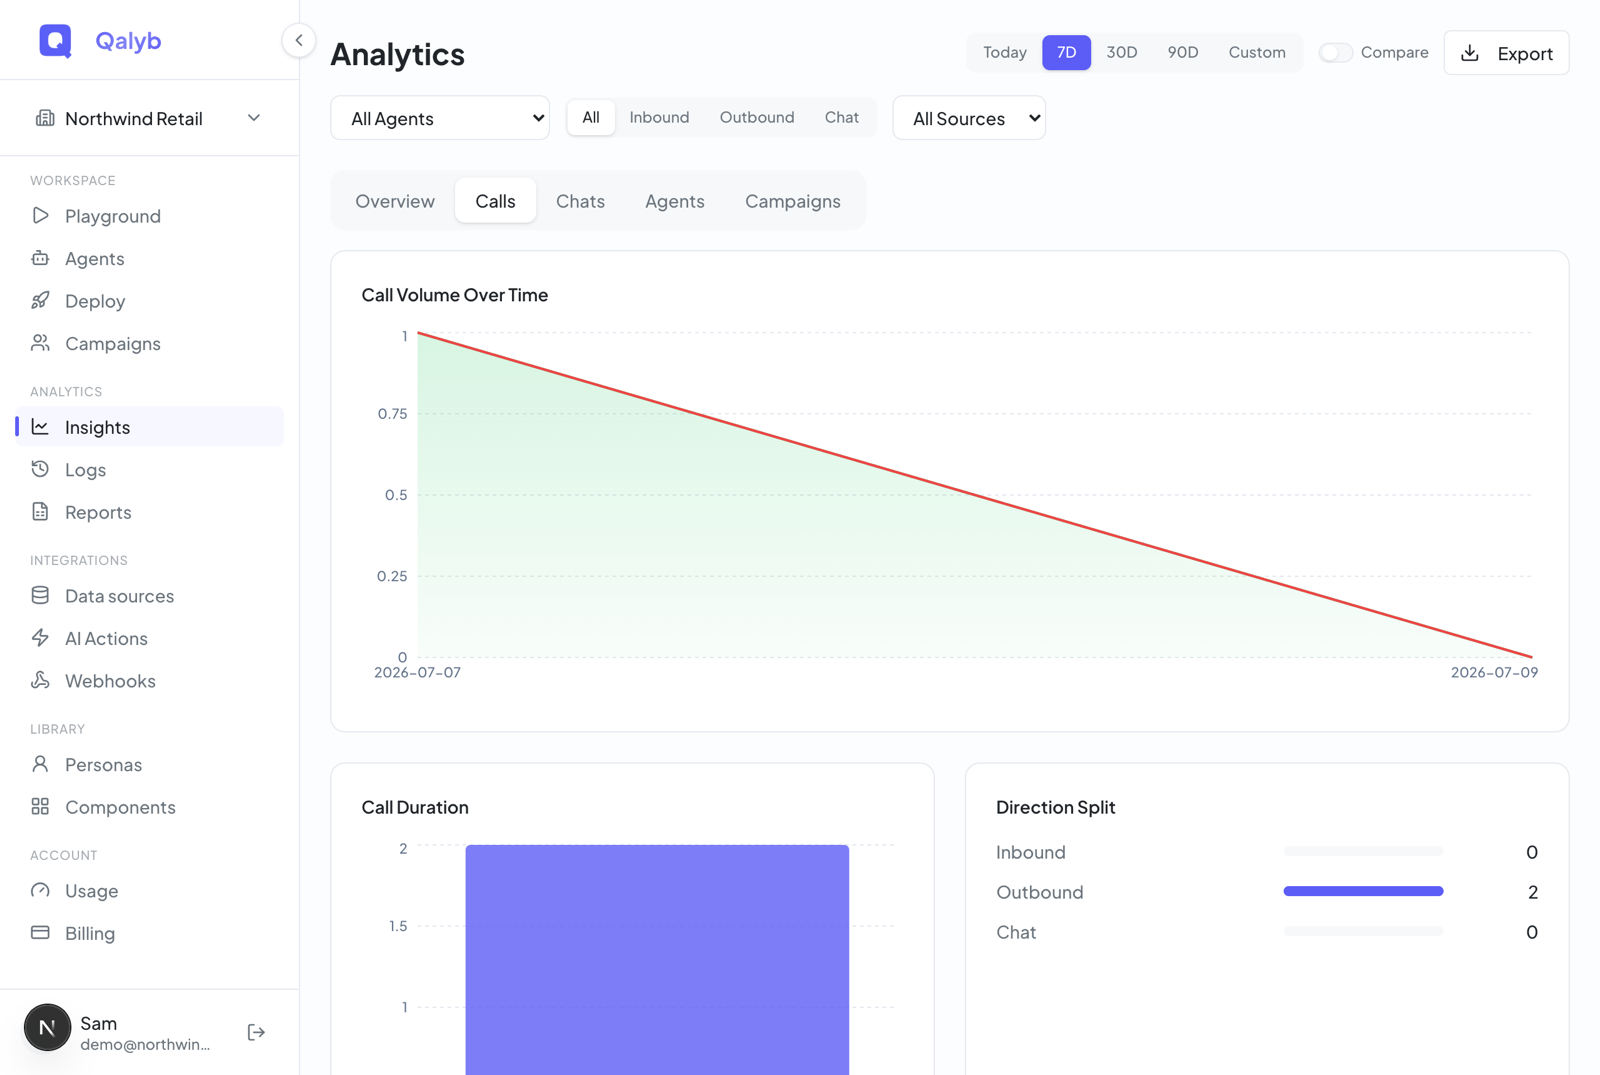
The Calls tab is the voice-only deep dive (it excludes chat sessions). It adds:
- Duration distribution — calls bucketed into 0–30s, 30s–1m, 1–3m, 3–5m, and 5m+.
- Hourly heatmap — call density by hour across the days of the week, so you can see when demand peaks.
- Direction split — inbound versus outbound versus chat.
Chats
Chats is the chat-only mirror of Overview: chat KPIs, a chat-volume chart, a source breakdown, and the top agents — the same shape of metrics, scoped to text conversations from widgets, share links, and messaging channels.
Agents
The Agents tab is a per-agent table. Each row shows that agent's metrics with a 7-day sparkline and sentiment counts, so you can compare agents side by side and spot which ones are trending up or down without leaving the page.
Campaigns
The Campaigns tab breaks results down per outbound campaign — one row each, plus a conversion funnel: total contacts → called → connected → completed. Campaign names and contact totals are shown so each row is readable at a glance, not just an id.
Take a tour
Click Insights under the Analytics group in the sidebar. The dashboard opens on the Overview tab.
Pick a range — Today, 7d, 30d, 90d, or Custom with explicit from and to dates. Turn on Compare to add period-over-period change to every KPI card.
Use the filter bar to focus on one agent, a single direction (inbound, outbound, or chat), or any conversation source — playground, widget, share link, campaign, API, telephony, WhatsApp, Telegram, Messenger, Instagram, or email.
Move between Overview, Calls, Chats, Agents, and Campaigns. The active tab is stored in the ?tab= URL parameter, and every filter lives in the URL too — so the exact view is a shareable link.
Click Export in the header to download the current Overview KPIs as a CSV. For full, formatted Excel workbooks of your session data, use Reports & exports.
How fresh is the data
Insights reads from a separate analytics store that mirrors your live data with a delay of roughly ten seconds — near-real-time, but not instant. A call that just ended may take a moment to appear.
For developers
Every tab is backed by a read endpoint. All require the calls:read permission and the insights entitlement, and they accept the same range, compare, and filter parameters as the dashboard header.
curl "https://api.qalyb.ai/analytics/overview?range=30d&compare=true" \
  -H "Authorization: Bearer sk-live-..."
Filter a voice-only view by agent and direction:
curl "https://api.qalyb.ai/analytics/calls?range=7d&agentId=<uuid>&direction=inbound" \
  -H "Authorization: Bearer sk-live-..."
Use a custom window and a source filter:
curl "https://api.qalyb.ai/analytics/overview?range=custom&from=2026-06-01&to=2026-06-27&source=campaign" \
-H "Authorization: Bearer sk-live-..."| Endpoint | Returns |
|---|---|
GET /analytics/overview | KPIs, call volume, status / sentiment / source breakdowns, top 5 agents |
GET /analytics/calls | Timeseries, duration distribution, hourly heatmap, direction split (excludes chat) |
GET /analytics/chats | Chat-only KPIs, timeseries, source breakdown, top agents |
GET /analytics/agents | Per-agent metrics with a 7-day sparkline and sentiment counts |
GET /analytics/campaigns | Per-campaign metrics plus the conversion funnel |
Query parameters
| Parameter | Values |
|---|---|
range | today, 7d (default), 30d, 90d, custom |
from / to | ISO dates, used when range=custom |
compare | true / false — previous-period comparison |
agentId | Agent UUID |
direction | all, inbound, outbound, chat |
source | playground, widget, campaign, api, telephony |